What is Clustering
Clustering is an unsupervised learning technique to extract natural groupings or labels from predefined classes and prior information. This is an important technique to use for Exploratory Data Analysis (EDA) to discover hidden groupings from data. Usually, I would use clustering to discover insights regarding data distributions and feature engineering to generate a new class for other algorithms
Clustering Application in Data Science
Seller Segmentation in E-Commerce
When I was an intern at Lazada (e-Commerce), I dealt with 3D clusterings to find natural groupings of the sellers. The Lazada sales team requested analysis to reward their performing sellers through multiple promotions and badges. However, to accomplish it, we needed to understand who the sellers were and how they performed. To do that, we feature engineered and selected three main dimensions: the customer reviews, the delivery and refund quality, and the product offerings (specialized sellers, or general sellers).
Based on these main criteria, we created 3D clustering visualization to identify our sellers. Based on the results, we classified these sellers and created reward and badges tracks for each. In the end, through AB testing, we increased 23% of critical seller performance and improved the general user experience metrics.
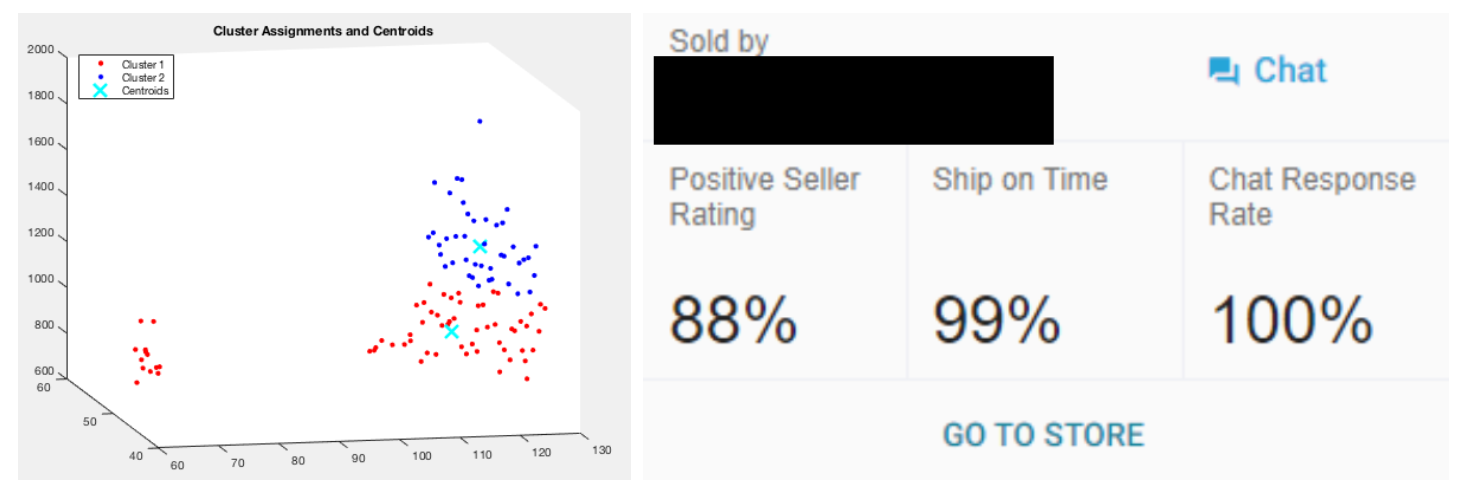
3-D Clustering using Scikit Learn and General Critical Seller Performance at Lazada. This is an example and not real representation to avoid NDA conflict (Non-Disclosure Agreement).
Other Applications
If this personal experience of mine is not enough, there are still many more clustering applications you can find in our life.
Label tagging: Imagine you want to classify many products such as cameras, clothes, and fridges. How do you know what are the proper labels to give to them? Should cameras, TVs, and Desktops be categorized under the same labels? How many labels should you create to better separate these products?
Customer Segmentation: Imagine that you are working to improve retail purchases. Could you classify groups of buyers based on their purchase patterns? What would be the proper labeling and promotion to increase spending from each customer segment?
Genre Selection in Recommendation System: Imagine Netflix to recommend us shows to watch. What are the proper labels or genres each recommendation should have to analyse the user’s watching behaviors? Is it a good idea to classify their views on the time period when the show is created?
All of these require clustering techniques to create natural groupings especially when in a multidimensional data complexity.
How Does Clustering Work?
Given a set of objects, we would like to cluster them; divide them into a set of groups.
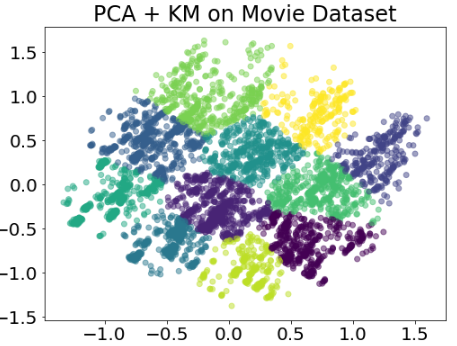
My separation of Clusters from IMDB Movie Data
In this visualization, you could directly see that there are a few natural groupings of the dots. This is easy to visualize because we only have 2 dimensions here (y axis and x axis). Therefore, we can highlight the groupings. But assuming we have many dimensions. How do we use these features to cluster them into groups?
The Clustering Objectives:
- Inputs: a set of objects: X. This is a distance metric D(.,.) where it defines inter object distances such that D(x,y) = D(y,x) where x, y E X.
- Output: Partitions of the objects such that Pd(x) = Pd(y) if x and y belong to the same cluster
This notion of similarity defined by distance reminds of k-nearest-neighor (KNN). This means we can stuff the objects inside particular clusters without any measurement of good or bad clusters. What matters is the distance function that we used to create the partitions and separate the groups.
This means that the solutions tend to have high variance and are dependent on the algorithm. Each clustering algorithm might bear different results of what the optimal clusters are. In this article, we are going to talk about Single Linked Clusters, K Means Clusters and Soft Clusters:
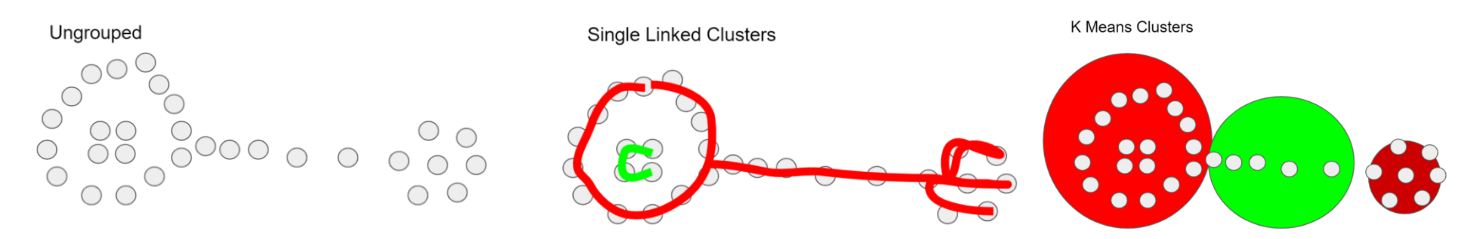
Ungrouped Dataset with Single Linked Clusters (2) and K Means Clusters (3)
Single linkage clustering
This is the simplest clustering algorithm.
Basic SLC Clustering Steps
Given an input of k number of clusters:
- We treat each object as cluster, with n clusters
- We define the inter cluster distance functions as the closest possible distance among multiple clusters
- Merge two closest clusters
- Repeat this algorithm n-k times to generate k clusters.
This algorithm reminds me of Connect the Dots which is a game where you link up points one by one to build a certain shape and structure.
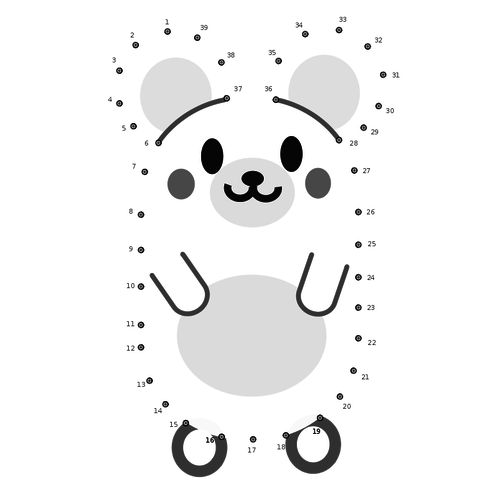
Connect the Dots (source)
Complexity and Limitation
Interestingly, this clustering algorithm possesses interesting properties: deterministic (it is run like MST — Minimum Spanning Tree algorithm) as it treats distances as edge lengths with the big notation O(n³) time complexity. we need to evaluate n² pairs within n times (worst case scenario). We need to repeat k times (n/2) but we also need to look at all distances to find the closest pair O(n) which has different labels.
Single Linked Clustering also applies heuristics to connect multiple close dots together which might not receive intended behaviors.
k-Means Clustering
K Means clustering is a simple and straightforward algorithm as each iteration only requires a handful of trivial operations. It also identifies convergence to a local/global minimum which means that we could increase the confidence level to trust the results.
Basic K-Means Clustering Steps
- Pick k random centroids
- Associate each point with closest center points
- Recompute centers by averaging the clustered points
- Repeat these steps until it converges.
K-Means Optimization Functions
- Configurations → Center, P
- Scores → Summation of Sum Squared Error from P Center and x.
- Neighborhood → the points with closest intracluster distance from centroids.
Paradigm Shift Compared to SLC
This requires a few paradigm shifts compared to SLC and is a widely used clustering algorithm in the world now.
- Taking a random location of cluster centers (centroids) rather than using the existing observation as the centers.
- Iterate through multiple memberships of observations which each centroid until no further improvements are seen (converge)
Complexity and Limitation
In terms of O notation, k means is more efficient than SLC — with polynomial time for each iteration O(kn).
However, there also downsides which we need to consider. First, the k in k means need to be identified before. This means, we need to analyse the optimum number of clusters (k) first by using elbow method, etc before running the algorithm. Second, the initial seeds/centroids we place will also affect our clusters greatly. Third, outliers will greatly affect our placed centroids and hence the cluster memberships. Finally, k means clustering assumed spherical clusters which might be a problem in some non spherical data distribution.
Previously we only talked about a certain observation with only one class as its membership. What if that observation is ambiguous?
Soft Clustering
Previously we only talked about a certain observation with only one class as its membership. What if that observation is ambiguous? Then we will mark the observation with 2 groups.
What would be the correct class to assign that observation? This remains unclear. What about if we assign this observation to both classes?
This is where soft clustering comes in. It uses probability certainty to identify the possible clusters using the selected Gaussian Distribution. The goal is to maximize the likelihood of the data to belong to a certain class. This is defined as Expectation Maximization (EM clustering).
Interestingly since EM is a probability based clustering, this means that there is infinite number of configurations. You never do worse but you keep moving closer and never approach the final best configuration.
Properties of Clustering Algorithms
So how do we choose which cluster to use? We would need to consider the following properties for our clustering algorithm. Each property will vary depending on the data pattern and distance matrix that we use.
- Richness: For assignment of objects to clusters, there is some distance matrix D such that the clusters converge already sets limits on the number of clusters that gives the best fit. If we stop the SLC algorithm prematurely when the clusters have not reached k, we will sacrifice richness as we limit the number of clusters.
- Scale-Invariance: Given that we upscale the distance metrics with an arbitrary constant (such as from Celsius to Fahrenheit), the cluster membership results should not change. If the clusters are in a certain unit apart, scaling the results would change the resulting cluster membership. If we stop the SLC algorithm prematurely when the clusters are a predefined value unit apart, we will sacrifice scale-invariance.
- Consistency: By compressing or expanding the points, no points would divert to another cluster. If the clusters are a degree identified units with maximum distance identified, then we might transform this distance formulation and alter the cluster membership. This means that the cluster should not change when we make similar points more similar or dissimilar points more dissimilar. If we stop the SLC algorithm prematurely when the clusters are a predefined value unit divided by the longest intracluster distance, we will sacrifice consistency.
Ideally, your clustering should be all three of these properties. But, unfortunately this is impossible as mentioned on Impossibility Theorem. Feel free to review the proof inside this paper.
There is no clustering scheme which achieves all three: richness, scale invariance, and clustering — Jon Kleinberg 15
Finally…
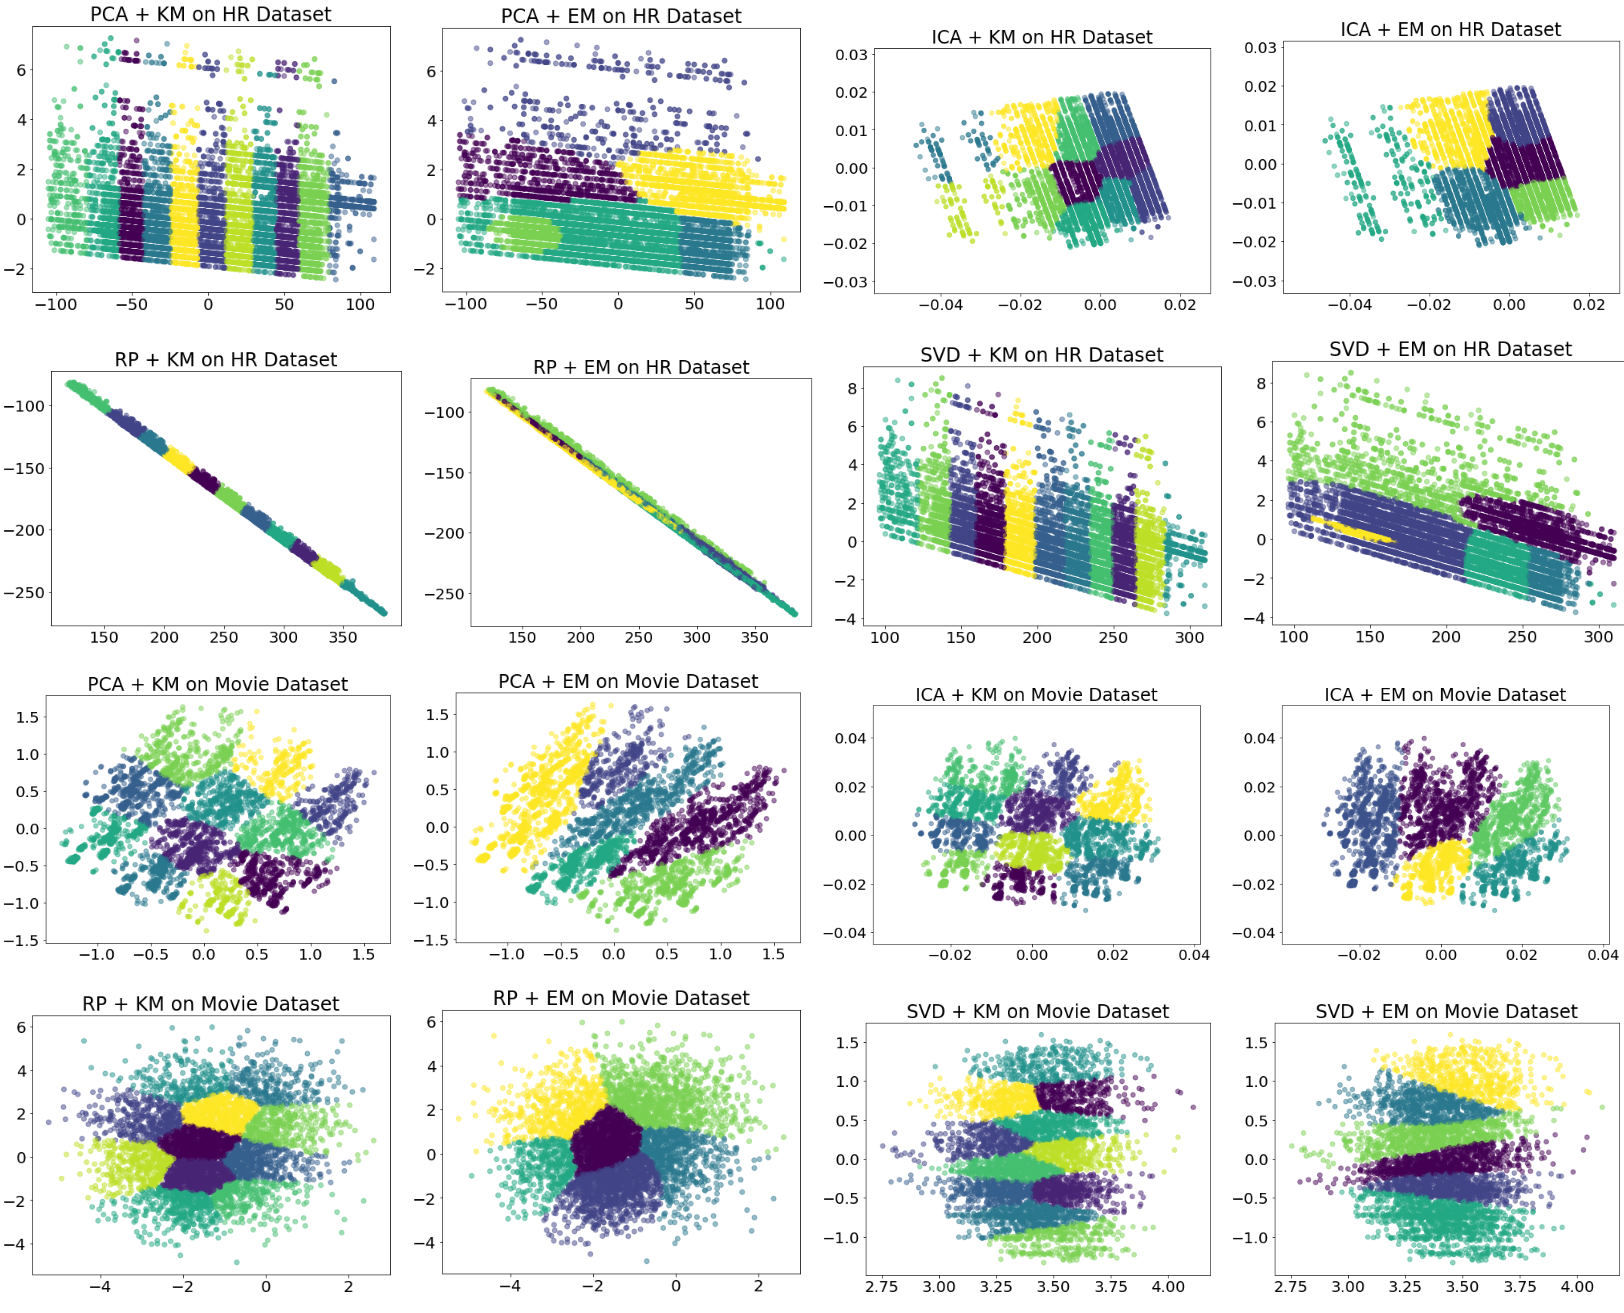
My Own Clustering Analysis using Various Clustering and Feature Transformation Techniques
I really hope this has been a great read and a source of inspiration for you to develop and innovate.
Please Comment out below for suggestions and feedback. Just like you, I am still learning how to become a better Data Scientist and Engineer. Please help me improve so that I could help you better in my subsequent article releases.
Thank you and Happy coding :)
Disclaimer: This is created as a review note for me to refresh my knowledge on Machine Learning from Georgia Tech OMSCS Lessons. Many of the references come from Georgia Tech Classes and external resources.
About the Author
Vincent Tatan is a Data and Technology enthusiast with relevant working experiences from Google LLC, Visa Inc. and Lazada to implement microservice architectures, business intelligence, and analytics pipeline projects.
Vincent is a native Indonesian with a record of accomplishments in problem-solving with strengths in Full Stack Development, Data Analytics, and Strategic Planning.
He has been actively consulting SMU BI & Analytics Club, guiding aspiring data scientists and engineers from various backgrounds, and opening up his expertise for businesses to develop their products.