
In this article, I will present the 22 questions in fundamental statistics that you may encounter during interviews.
1, What is Hypothesis Testing?
Hypothesis Testing is a method of statistical inference. Based on data collected from a survey or an experiment, you calculate what is the probability (p-value) of observing the statistics from your data given the null hypothesis is true. Then you decide whether to reject the null hypothesis comparing p-value and significance level. It is widely used to test the existence of an effect.
2, What is the p-value?
P-value is the probability of observing the data if the null hypothesis is true. A smaller p-value means a higher chance of rejecting the null hypothesis.
3, What is the confidence level?
The confidence level in hypothesis testing is the probability of rejecting the null hypothesis when the null hypothesis is True:
P(Not Rejecting H0|H0 is True) = 1 - P(Rejecting H0|H0 is True)
The default statistical power is set at 95%.
4, What is the confidence interval?
In contrast to point estimation, a confidence interval is an interval estimation of a parameter obtained through statistical inference. It is calculated by:
[point_estimation - cv*sd, point_estimation + cv*sd]
where cv is the critical value based on the sample distribution, and sd is the standard deviation of the sample.
It is essential to interpret confidence in the confidence interval. For example, if I say the 95% confidence interval for the bus waiting time is [5 min,10 min], what am I actually saying? Please check out my article here for more details:
5, What is the statistical power?
Statistical power measures the probability of rejecting the null hypothesis when the null hypothesis is False:
P(Reject H0|H0 is False) = 1- P(Not Rejecting H0|H0 is False)
The default statistical power is set at 80%.
6, What is Type I error, and what is Type II error?
Type I error is P(Rejecting H0|H0 is True), is False Positive (Thank Koushal Sharma for capturing the typo here), is ⍺, is one minus confidence level;
Type II error is P(Not Rejecting H0|H0 is False), is False Negative, is β, is one minus statistical power.
There is a trade-off between Type I error and Type II error, meaning that if everything else stays the same, to decrease Type I error, we need to increase Type II error.
If you are interested in connecting Type I error and Type II error with the classification metrics in machine learning models, read my article for more details:
7, What is the Central Limit Theorem (CLM)?
The Central Limit Theorem states that no matter what is the population’s original distribution, when taking random samples from the population, the distribution of the means or sums from the random samples approaches a normal distribution, with mean equals to the population mean, as the random sample size gets larger:

image from Wikipedia
8, What is the Law of Large Numbers?
Law of Large Numbers states that as the number of trials gets large enough, the average result of the trials will become closer to the expected value. For example, when you toss a fair coin for 1000 times, you are more likely to see Heads half of the time than tossing a fair coin only 100 times.
9, What is the standard error? What is the standard error of mean?
Standard error of a statistic is the standard deviation of its sampling distribution or an estimate of that standard deviation.
Using CLM, we can estimate the standard error of mean by using population standard deviation divided by the square root of sample size n. If the population standard deviation is unknown, we can use the sample standard deviation as an estimation.
10, How to choose the sample size for an experiment?
The sample size is closely related to the sample’s standard error, the desired confidence level, power, and effect size. Sample size increases as the sample’s standard error, confidence level, and power increases, or as the sample’s effect size decreases. Please check out this article for the intuition behind:
11, What is bootstrapping?
Bootstrapping is one of the re-sampling techniques. Given a sample, you repeatedly take other random samples from it with replacement. Bootstrapping is useful when the sample size is small, and when you need to estimate the empirical distribution. We can estimate the standard error of the median using bootstrapping. Please read the article below for more details:
How to estimate the standard error of the median: The Bootstrap StrategyIn this article, I will discuss the method we can use to estimate the standard error of the median. I will first…towardsdatascience.com
12, What is sample bias?
Sample bias is the sample taken to statistic inference is not a great representation of the entire population. It is because of several reasons:
1, sampling bias: non-random sampling;
2, selection bias: the sample doesn’t represent the entire population. For example, passing a survey in universities when you want to estimate the average income for all adults;
3, response bias: either because of too few responses or because only certain types of subjects will respond to the survey. For example, a survey for a professor’s teaching skills may only respond by students like or really hate the professor;
4, survivorship bias: bias from overlooking subjects that did not make it past the selection process.
13, How to detect outliers?
Outliers are observations that differ significantly from other observations. Detecting outliers is the same as defining the difference. The most straightforward way is to plot the variable and find the data points that are far away from others. To quantify the difference, we can use the quartiles and Interquartile Range (IQR). IQR is the third quartile minus the first quartile (Q3-Q1). The outliers are any data points that are less than Q1–1.5*IQR, or larger than Q3+1.5*IQR.
If the data follows a normal distribution, the outliers are the points with a Z score larger than 3 or smaller than -3.
What is mean/median/mode, when is median better than mean in measuring central tendency?
14, What is Bayesian inference?
Bayesian inference is a method of statistical inference in which Bayes’ theorem is used to update the probability for a hypothesis as more evidence or information becomes available. Bayes’ theorem is stated below:
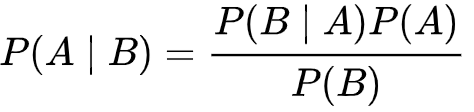
where P(A) is a prior belief, P(B) is the evidence, and P(B|A) is the conditional probability of event B occurs when A occurs.
15, What is Maximum Likelihood Estimation (MLE)?
Maximum Likelihood Estimation is estimating the parameter by maximizing the likelihood function using Bayes’ theorem. According to Bayes’ theorem:
where P(θ) is the prior distribution for the parameter; P(y|θ) is the likelihood function describing the likelihood of observing the data points y when we have the parameter θ; P(y) is the evidence, which is usually used to normalize the probability. Maximizing P(θ|y) is the goal of finding the optimal θ, where we maximize the conditional probability of having θ given all the data points y. In practice, we can easily calculate P(y|θ) once we know the distribution. Thus, we solve the optimizing problem by maximizing the likelihood function P(y|θ) with respect to θ.
16, Solving the following question using the Bayes’ theorem:
1, 50% of all people who receive a first interview receive a second interview
2, 95% of your friends that got a second interview felt they had a good first interview
3, 75% of your friends that DID NOT get a second interview felt they had a good first interview
If you feel that you had a good first interview, what is the probability you will receive a second interview?
The key to solving problems like this is to define the events carefully. Suppose your friends are a good representation of the entire population:
- Let's define feel good about the first interview as event A, and define receive the second interview event B;
- According to 1, P(B)=0.5, thus P(not B) is one minus P(B), which is 0.5 as well;
- According to 2, P(A|B) =0.95;
- According to 3, P(A|not B) = 0.75.
- Given P(B), P(A|B), P(A|not B), what is P(B|A)?
According to Bayes’ theorem:
thus:
17, What is the difference between correlation and causation?
Correlation is the relationship between two variables, it can be positive, negative, zero, or little correlation depending on the sign and size of the following equation:
Correlation between X and Y
where:
Covariance of X and Y
Cov(X, Y) is the Covariance of the two variables, and Cor(X, Y) is normalized by the standard deviation of X and Y (Sx, Sy) so that correlation can be between -1 and 1. When correlation equals to -1, X, Y have a perfect negative correlation and when it equals to 1, they have a perfect positive correlation. When the absolute value of correlation is close to zero, X, Y have little correlation with each other.
Causation is much more difficult to capture, it is the relationship between X and Y such that X has caused Y to happen, or vice versa. For example, in a study, you may observe people eat more vegetables a day are healthier, there is clearly a positive correlation between eating vegetables and healthy level. However, if only based on this information, you cannot claim that eat more vegetable causes you to be healthier, which is stating a causal relationship. You may observe this relationship because the subjects in your study have other healthy lifestyles (omitted variables) that could improve their health level, and eating vegetables is just one of the healthy habits they have. Finding a causal relationship requires additional information and careful modeling.
18, What is Simpson’s Paradox?
Simpson’s paradox refers to the situations in which a trend or relationship that is observed within multiple groups disappears or reverses when the groups are combined. The quick answer to why there is Simpson’s paradox is the existence of confounding variables. I have an article that explains Simpson’s paradox with an example:
19, What is the confounding variable?
A confounding variable is a variable that is correlated with both the dependent variable and the independent variable. For example, when checking the causal relationship between smoking and death rate, age is a confounding variable because as age goes up, the death rate increases, and the smoking rate decreases. Failing to control age can cause Simpson’s Paradox in statistical inference.
20, What is A/B testing, when can we use it, and when can we not use it?
A/B testing is conducting a randomized experiment with two variants, A and B. Through statistical hypothesis testing or “two-sample” hypothesis testing, A/B testing is a way to compare two versions of a single variable, typically by testing a subject’s response to variant A against variant B, and determining which of the two variants is more effective. It is commonly used to improve and optimize the user experience and marketing strategies.
Not every experiment can be conducted by A/B testing:
- A/B testing is not good for testing long-term effect
- A/B testing can only compare two versions, but cannot tell you what you are missing
- A/B testing cannot be used when there is a network effect in the market. For example, you cannot increase some consumer’s prices while decreasing others in the same market because it will twist the market demand.
21, What is PMF/PDF?
A probability mass function (PMF) is a function that gives the probability that a discrete random variable is exactly equal to some value. The PMF does not work for continuous random variables, because for a continuous random variable P(X=x)=0 for all x∈R. Instead, we can usually define the probability density function (PDF). The PDF is the density of probability rather than the probability mass:
PDF at x0
22, Summarize the important distributions.
I have an article that summarizes the most important distributions, including their assumptions, PDF/PMF, simulations, etc. Please check it out here:
Here are all the 22 fundamental statistical questions. Help this article helps you prepare for your interviews or refreshing your memories in the stats class. Thank you for reading!
If you feel ready to interview and apply for a job as a data scientist, please go to the following link.


